
There is no shortage of research on the benefits of dividend investing. The most tangible benefit is the consistent occurring cashflow that comes into a portfolio as dividends are paid. Investors not only benefit from compounding over time, but their portfolio may benefit from lessened swings in value due to the consistent inflow of dividend payments1.
Our experience has shown that when choosing dividend payers, there are three important characteristics when choosing companies.
Part 1: Go Beyond Yield
Part 2: Dividend growth leads to better governance and company quality
A company’s risk profile is always changing
Part 1: Go Beyond Yield
The last several years have seen a dramatic shift in the interest rate landscape. In March 2009 the Federal Reserve began Quantitative Easing. On April 1st 2009 the US 10 Year treasury yield stood at 2.65% and the S&P500 had a yield of 3.43%. More recently, the Federal Reserve has been actively raising interest rates to remove their previous accommodation and combat inflationary pressures. As of January 31st 2023, the US 10 Year treasury yield stood at 3.53% and the S&P500 had a yield of 1.57%. Given the concerns about inflation, investors have shown a preference for equities and due to the “scarcity of yield”, the higher yielding dividend paying segment was favored over the last decade plus.
Typically, to find yield, investors have historically focused on sectors that demonstrated “constant demand”, which many investors perceived as helping to offset some uncertainty. Those higher than market yields and demand characteristics are typically found in Consumer Staples and Utilities. On April 1st, 2009 the yields in those sectors stood at 2.68% for Staples and 4.74% for Utilities respectively. As of January 31st, 2023, those same sectors had yields of 2.50% and 3.02% respectively2. Investors perceived these sectors as “defensive” as the population consistently needs to eat and power their homes. Given the mature nature of these sectors companies that reside within them tend to have slower dividend growth due to their higher dividend yields. As a result, dividend growth rates typically reside in the mid-single digit range as they tend to grow a little faster than economic growth rates. However, it’s also important to consider the effects of inflation.
According to the Federal Reserve Economic Database (FRED), the Consumer Price Index stood at 212.71 on April 1, 2009. As of January 31, 2023, the Consumer Price Index reached 300.54, an overall 41% increase. If an investor focused on higher yielders with slower growth, a minimum 2.7% dividend growth rate would be required to just keep pace with CPI during that same period. As a result of maximizing dividend yield the tradeoff means also settling for slower growth. This can be a trap that yield seeking dividend investors fall into which may also potentially lead towards lower total returns. While dividend yields are important, the growth of dividend cannot be understated.
In March 2009, investors were most likely drawn to the higher yielder. Exhibit 1 is an example of two companies. Company A offered a dividend yield that was higher than Company B, however, the higher yielding Company A also had a slower dividend growth rate. Company B, the dividend grower, provided the strongest propulsion towards compounding. Over this timeframe, the lower yielding Company B ended up having a higher yield at cost (dividend divided by cost basis) over the higher yielding Company A. More importantly the cash flow from Company A almost tripled during the timeframe whereas Company B grew by 89%.
Exhibit 1: High yielder w. slow dividend grow vs. Lower yielder with fast dividend growth

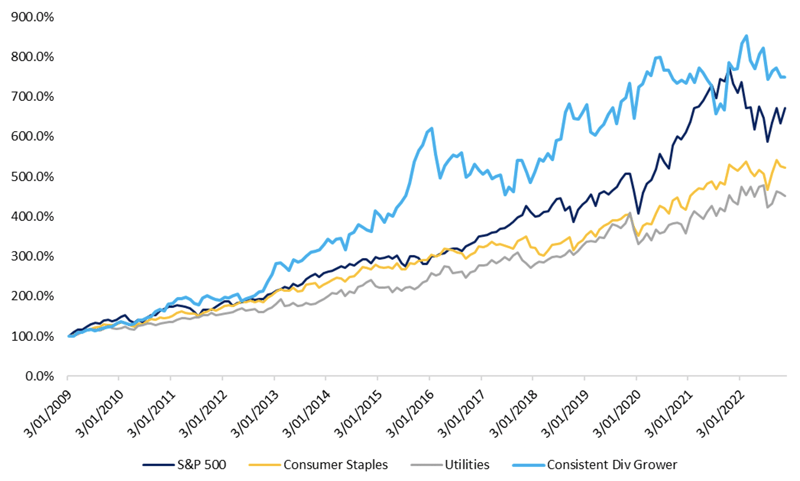
To underscore the importance of company selection, exhibit 2 shows the total return performance of the S&P500, Consumer Staples, and Utilities. Also inserted is a consumer staples company that demonstrated 11% consistent dividend growth since 2009. This same company had almost the same characteristics in the previous example. The yield for this company was 2.38% on April 1, 2009, which was not only lower than the Consumer Staples Sector but also much lower than the S&P500.
When selecting companies, the importance of underlying fundamentals, which drives dividend growth, is especially important.
Exhibit 2: Total Return of S&P500, Consistent Dividend Grower, Utilities, and Consumer Staples
(April 1, 2009 – January 31, 2023)
Source: Factset Research, Brentview Investment Management Research
Part 2 - Why Dividend Growth? (Coming Soon)
Footnotes & Sources:
1Dividends are not guaranteed and can change.
2Historical yield data for the S&P500, US 10 Year Treasury, Consumer Staples and Utilities sectors provided by Factset
3 Federal Reserve Database (FRED) https://fred.stlouisfed.org/series/CPIAUCSL
Endnotes
Beta: A measure of risk that tracks the relative volatility of an investment versus a corresponding benchmark. A beta of 1 indicates that the investment has historically moved in-sync with the benchmark. An investment with a beta greater than 1 indicates that the investment has been more volatile than the benchmark overall. For example, a beta of 1.5 means that the investment is 1.5 times more volatile than the benchmark. An investment with a beta less than 1 indicates that the investment is has been less volatile than the benchmark.
Diversification: The practice of investing in multiple asset classes and or securities with different risk characteristics to reduce the risk of owning any single investment.
Dividend Growth Rate: The annualized percentage rate of growth that a particular stock's dividend undergoes over a period of time.
Dividend yield: for a company’s stock, the ratio of the dividends paid out by the company each year per share to the share’s current market price.
Earnings per Share (EPS): the portion of a company’s profit allocated to each share of common stock. Earnings per share serve as an indicator of a company’s profitability.
Payout ratio: the percentage of earnings paid to shareholders in dividends.
Price/earnings ratio (P/E ratio): the ratio of a stock’s current price to its per share earnings over the past year. For a fund, the ratio is the weighted average P/E of the stocks in the fund’s portfolio. A forward P/E uses estimated earnings for the next four quarters in the denominator. P/E is often an indicator of market expectations about corporate prospects; usually, the higher the P/E, the
greater the expectations for a company’s future growth in earnings.
Recession: defined as a significant decline in economic activity spread across the economy, lasting more than a few months, normally visible in real GDP, real income, employment, industrial production, and wholesale-retail sales.
Standard deviation: a measure of the degree to which returns varied from the average return over a certain period. It is a common measure of volatility and risk.
S&P 500®: an unmanaged index generally considered representative of the U.S. stock market.
Volatility: The amount and frequency of fluctuations in the price of a security, commodity, or a market within a specified time period. Generally, an investment with high volatility is said to have higher risk since there is an increased chance that the price of the security will have fallen when an investor wants to sell.
Risks and other important considerations
PROVIDED FOR INFORMATIONAL PURPOSES ONLY. This material is not intended to be a recommendation or investment advice, does not constitute a solicitation to buy or sell securities, and is not provided in a fiduciary capacity. The information provided does not take into account the specific objectives or circumstances of any particular investor or suggest any specific course of action. Investment decisions should be made based on an investor’s objectives and circumstances and in consultation with his or her advisors. Investing entails risk, including the possible loss of principal. There can be no assurance that any investment or asset class will provide positive performance over any period of time. Dividend yield is one component of performance and should not be the only consideration for investment. Dividends are not guaranteed and will fluctuate. Equity investments such as large-cap stocks are subject to market risk or the risk of decline in response to adverse company news, industry developments, or a general economic decline. Past performance does not guarantee future results.
The statements contained herein reflect the opinions of Brentview Investment Management, LLC (“Brentview”) as of the date written. Certain statements are forward looking and/or based on current expectations, projections, and information currently available to Brentview. Such statements may or may not be accurate over the long-term. While we believe we have a reasonable basis for our comments and we have confidence in our opinions, actual results may differ from those we anticipate. We cannot assure future results and disclaim any obligation to update or alter any forward-looking statements, whether as a result of new information, future events, or otherwise. Statistical data was taken from sources which we deem to be reliable, but their accuracy cannot be guaranteed.
Brentview Investment Management, LLC, is a registered investment adviser.
If you would like to learn more about Brentview Investment Management and the Dividend Growth Strategy please, click here
 |
 |
 |