In the fourth quarter, our strategy underperformed the S&P 500, our primary index, returning 7.6% vs. 9.1% for the index. For 2019, our strategy outperformed the index by 260 basis points, returning 34.1% vs. 31.5% for the index. Ultimately 2019 was the best performing year for the S&P 500 index since 2013. Progress towards a China and USA “skinny” trade deal encouraged investors to take on more risk and that became more evident as the quarter progressed. The Federal Reserve earlier in the quarter lowered the Federal Funds rate target to 1.50%-1.75% as the trade wars fears began to impact the economy. As time passed, yield curve inversion fears seemed to fade into the rear-view mirror and even cracks in the overnight Repo markets went unnoticed.
Summary:- On a gross basis our strategy underperformed the S&P500, our primary index for the 4th quarter but outperformed for the full calendar 2019 year
- Information Technology sector led during the quarter, driven by developments in the China trade talks
- Dividend Payments for the S&P500 grew by 6.4% and payers in the index experienced an average 8.1% dividend increase in 2019
- Fourth quarter S&P500 earnings are now estimated to decline 2% and are on pace for a fourth straight quarterly decline
- Overall valuations appear to be rich at 18.4x forward 12-month earnings. Valuations are even richer in defensive sectors such as utilities, real estate, and consumer staples
The best performing sector in the fourth quarter was information technology followed by healthcare. Semiconductor stocks were one of the best performing industries in technology, a cyclical group with international exposure and subject to the news regarding the China trade deal. Real Estate and utilities were the worst performing sectors in fourth quarter after rising over 20% in the first 9 months on the heels of falling interest rates.
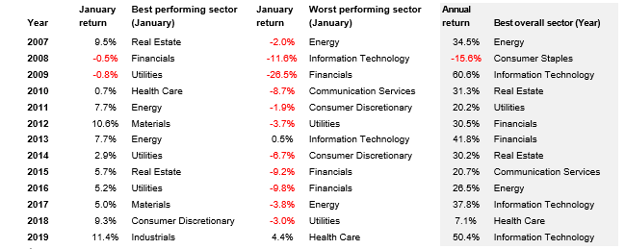
As seen in Exhibit 1, history has shown that the best sector in January is not always the best sector the following year. We would anticipate that 2020 will continue the same trend. Over the last 13 years, the best performing sector for the month of January has never been the best performing sector for the year.
Exhibit 1. January sector performance vs. year end

Source: Factset
Earnings growth for the S&P 500 may decline 2% in the 4th quarter of 2019 marking four straight quarters of earnings decline. Dividend growth has been slowing along with earnings. In 2019 dividend payments for the S&P 500 index were up 6.4%, which is a decline from the 8.4% growth rate for 2018. However, payers in the index increased their respective dividends by 8.1%. During that same timeframe our portfolio experienced an 8.5% average dividend increase, outpacing the market. In 2020, the fastest dividend growth is estimated to come from the technology, financials, and the health care industry sectors. The slowest sector dividend growth is estimated to come from utilities and real estate.
Do dividends matter anyway?
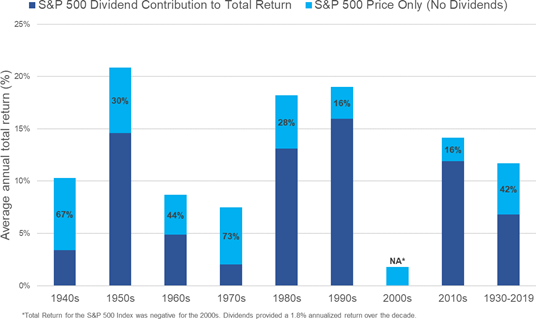
The answer is that it depends on the decade. With the 2010’s having just ended, dividends contributed just 16% to total return (Exhibit 2). This is well below the long-term historical average of 42% since 1930. What do the 2020’s have in store? Logic would suggest a mean reversion. Certainly, if equities produce single digit returns, the next 10 years will see that dividends become a larger component of total return.
Exhibit 2. Dividends' Contribution to Total Return

Source: Factset
So, what keeps you at night?
The stock market has just returned over 30% in 2019 and 2020 obviously can’t be a good year, right? Historically the U.S. Presidential election cycle has led to spikes in volatility in that calendar year. Along the same lines, every four years, health care equities become more volatile, especially managed care and pharmaceutical companies due to uncertainty of the congressional election results. Overall valuations for the S&P 500 Index appear to be rich at 18.4x forward 12-month earnings. Valuations are even richer in defensive sectors such as utilities, real estate, and consumer staples. Moreover, corporate debt levels are near all-time highs and despite low unemployment, wage gains remain muted. All of these items suggest that company selection and fundamental research will be ever more important.
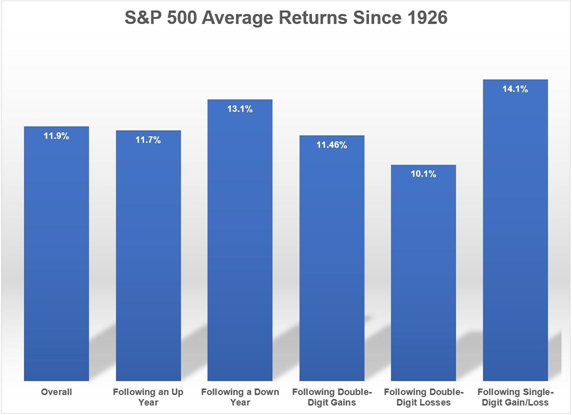
Since 1926, as seen in Exhibit 3, equities have appreciated by double digits on 55 occasions. However, more than half the time equities were up double digits for the following year. History has shown only three periods where equities were down double digits in the year following a double-digit gain (1936, 1965, and 1972).
Exhibit 3. S&P 500 Average Returns-Year following

Source : A Wealth of Common Sense
Our recent portfolio changes were designed to enhance overall portfolio dividend growth and stay the course with our investment process. We achieved this by selling companies with slow dividend growth prospects. In addition, our last several purchases were companies projected to have 10% or higher dividend growth rates. We projected future free cash flows for these companies to determine their dividend growth potentials.
As in the past, we will be opportunistic to find companies that can provide income with capital appreciation potential. It seems now growth equities that pay a dividend are no longer a stigma, case in point Microsoft and Apple. As a result, we would not be surprised if more dividend initiators occur, which should provide an opportunity for fundamentally focused investors that are not constrained by the length of dividend history.
