
The second quarter of 2022 marked the worst return since the first quarter of 2020, when the pandemic first occurred in the United States. Like the 2020 timeframe, our strategy held up better than the index as Dividend Growth outperformed the S&P 500 index, our primary index, during the 2nd quarter. On a gross and preliminary basis, the strategy returned -10.5% versus the index which returned -16.1%. Relative to the index, stock selection was paramount as we outperformed in ten of the eleven industry sectors. Energy was the only sector where stock selection detracted from our quarterly results. From a portfolio positioning standpoint, our overweight in Consumer Staples and underweight in the Consumer Discretionary also contributed.
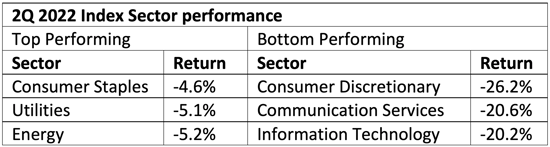
It was an especially difficult quarter for the S&P 500 index with all eleven industry sectors posting negative returns. As seen in Table 1 defensive sectors such as consumer staples and utilities held up the best. Energy also did relatively well but gave up its large gains earlier in the period to become the worst sector in the month of June. The sectors that lagged in the second quarter were consumer discretionary, communication services, and technology all groups normally associated with growth stocks.
Table 1
To underscore the broad-based impact, the first half of 2022 set off records across all segments of the equity markets for “the worst starting 6 months of a calendar year”. The S&P 500 fell by 19.96% which surpassed its record set in 1970. The Dow Jones Index declined 15.3%. which was its worst first half of the year since 1962. Finally, the technology laden Nasdaq declined 29.5%, which equaled its worst first 6 months since the index inception. Despite this challenging backdrop, our dividend growth strategy was able to hold up better on a relative basis for the same timeframe, returning -14.1% gross and preliminary.
Inflation running at levels not seen in 40 years surprised equity markets. High oil prices, supply chain constraints, pandemic related government stimulus, a strong labor market, and the war in Ukraine have all contributed to rising prices. To help fight the effects of inflation, the Federal Reserve finally began raising interest rates and curtailing quantitative easing. However, in the month of June, economic data suggested that the economy was slowing. As a result. investors fled from speculative investments and rotated towards defensive dividend paying equities.
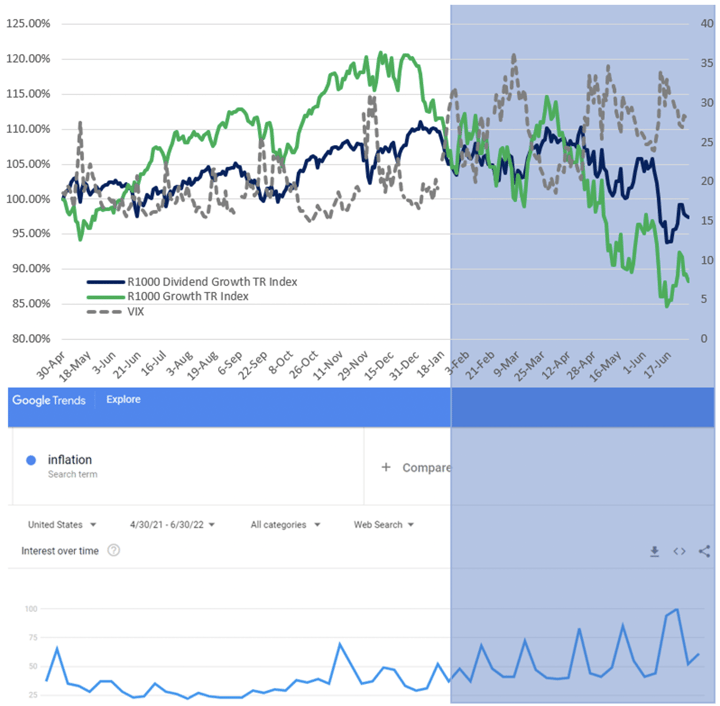
To illustrate this further, as seen in chart 1, we compared the total return of the Russell 1000 Growth (R1000G) vs. the Russell 1000 Dividend Growth (R1000DG). While the two indices might share some companies in common, the dividend growth index only focuses on dividend payers and requires a demonstrated and consistent dividend growth annually over a minimum ten-year period. To help capture sentiment, we overlaid the CBOE Volatility Index, aka the “Fear Index” and utilized Google Trends which displays the keyword search activity frequency in Google’s search engine. Taking these all together, we overlaid the period where “inflation” searches became more prevalent and is shaded in blue.
During this timeframe, the dividend-growth segment not only outperformed the growth segment, but also demonstrated substantially greater consistency and resilience. The resilience is especially evidenced as the frequency of “inflation searches” became more common starting in February 2022 until early June 2022. As shown by the R1000DG total return, investors who favored companies with demonstrated dividend growth would have experienced the desired defensive characteristics when they were needed most. Ultimately the total return of the R1000DG began and ended the shaded timeframe slightly lower and with significantly less volatility.
Chart 1
Russell 1000 Dividend Growth vs. Russell 1000 Growth Total Return Indices.
Incorporating CBOE Volatility Index and Google Trends data searching for “Inflation”
(April 30, 2021 – June 30, 2022)
The resulting action saw market price earnings multiples contract at a rapid pace. However, earnings estimates for the S&P 500 have not come down, which has increased concerns that the markets have more to fall. The current bear market 20% decline is pricing in a mild recession. This is roughly half the average bear market peak to trough drop of 35%-40%. Ultimately, the point of debate revolves around whether the US will enter a recession soon.
Over the past 75 years, as seen in Chart 2, anytime the unemployment rate is under 5% and inflation is over 4%, a recession ensues within two years. Currently, inflation is running well above 5% and unemployment is 3.6%.
Chart 2
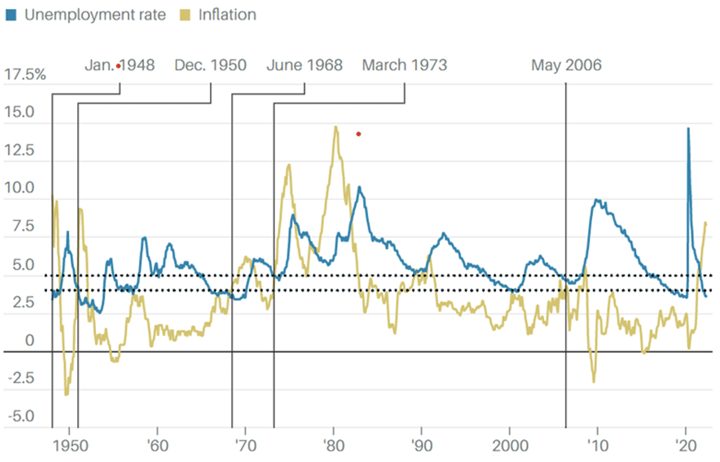
Source: Barron's
One forecasting measure points to a recession occurring right now. The Atlanta Federal Reserve has a forecasting tool called GDPNow. When accounting for the slowdown in personal consumption expenditures and the Institute of Supply Management manufacturing report, the Atlanta GDPNow forecast went from positive GDP to increasingly negative GDP in short order as seen in chart 2. US GDP was negative 1.6% during the first quarter of 2022. Another negative quarter in Q2 would fit the technical definition of a recession, with back-to-back negative GDP numbers. However, the National Bureau of Economic Research makes the final decision. The Bureau determination normally comes long after the recession has taken hold and the labor market is a one key component of their analysis.
Chart 3
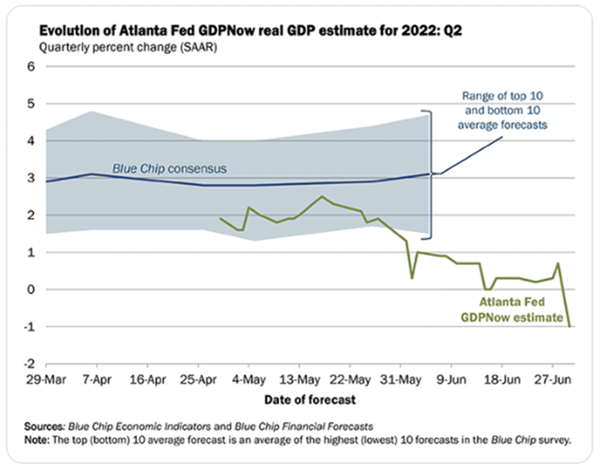
Source: Atlanta Federal Reserve GDPNow
As far as economic indicators, rising inventory levels are sometimes viewed as the canary in the coal mine for the US economy. A few pundits have cited high inventory levels as deflationary. However, when digging in deeper, the data is inconclusive. It’s clear that US inventories are rising (chart 4-left) but it seems centered on general merchandise at retailers like Walmart, Home Depot, Target, and Costco (chart 4-right).
Chart 4
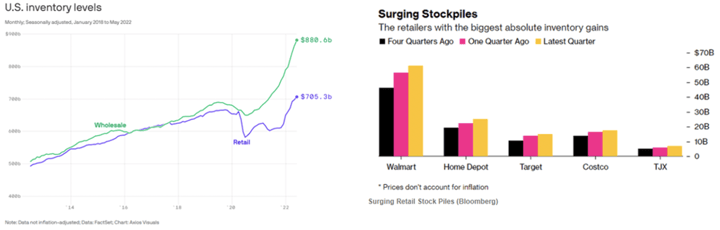
Source: Axios (left), Bloomberg (right)
Some of this fallout can be explained as consumers shifted from goods towards services as the pandemic waned and the economy reopened. Inventory levels might seem high in absolute terms, however, when looking at the inventory to sales ratio (chart 5), the amount of inventory seems to be at a very manageable level.
Chart 5
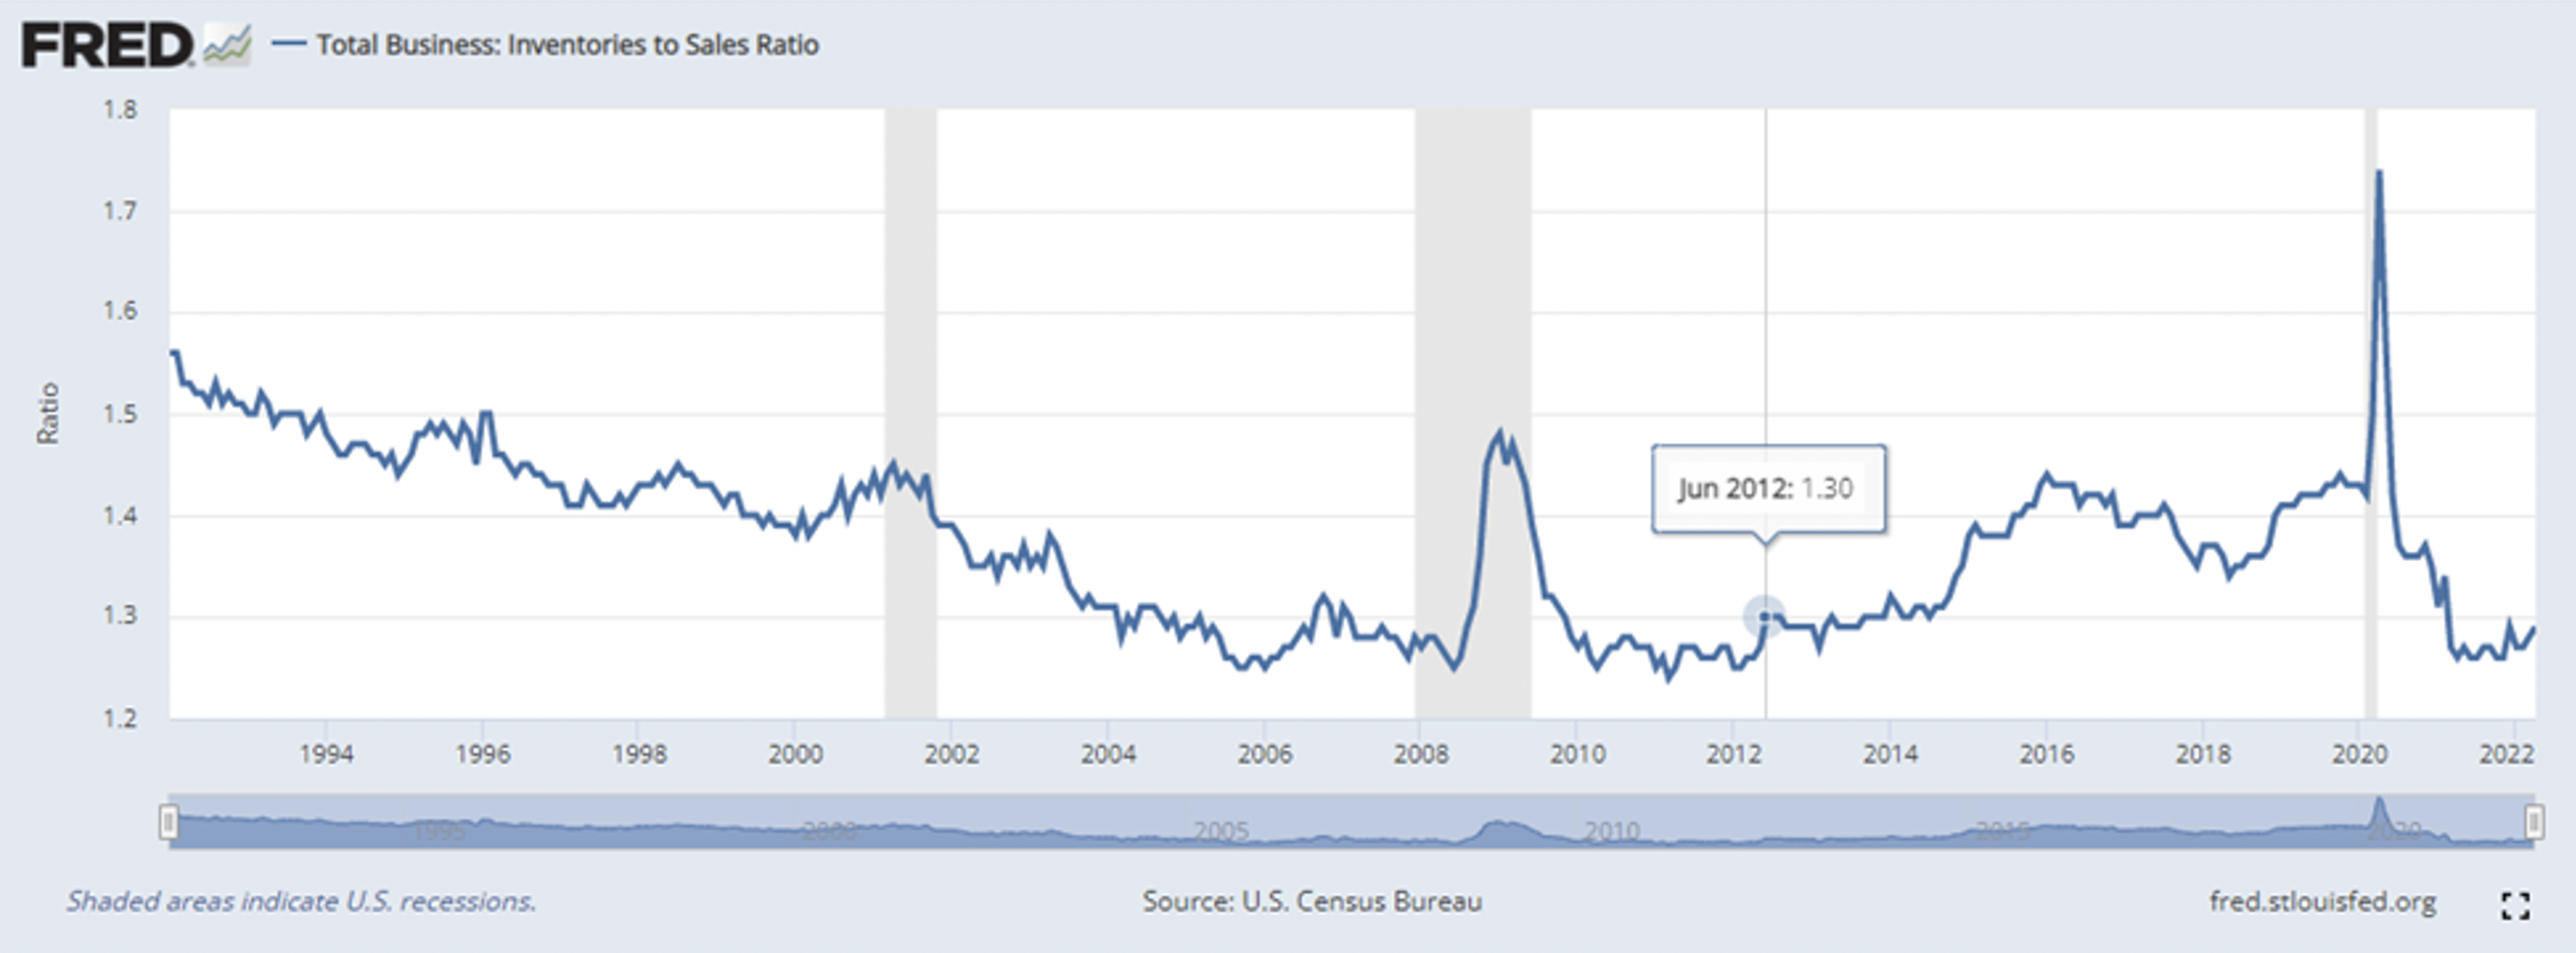
Source: Federal Reserve of St. Louis Database (FRED)
Dividend Growth Scorecard
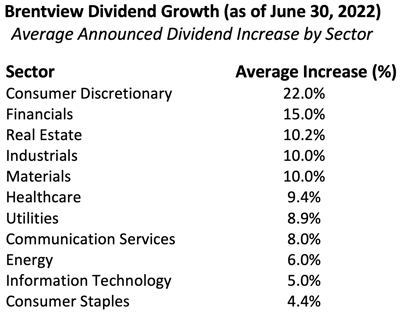
We are very encouraged to see that 51% of our portfolio holdings (twenty companies) announced dividend increases of 11.2% on average through June 30th. The companies announcing increases spanned across all eleven GICS sectors with the Consumer Discretionary sector leading with the largest announced average dividend increase to date. While dividend announcements tend to be seasonal, several technology and consumer staple companies have yet to make any announcements so far this year.
Outlook & Positioning
As a dividend growth manager, we seek companies with strong free cash flows that can support both growing dividend payments and share buybacks.
The economy is slowing down abruptly. RH, a high-end retailer formerly called Restoration Hardware cut their earnings estimates twice in June alone. Earnings estimates for the overall S&P 500 seem too high. Demand is softening and margins are being impacted by rising input costs. Until earnings estimates get ratcheted down the trough market valuation has not yet been reached. Additionally, the labor markets are showing modest signs of weakening. Job offers are being rescinded and modest layoffs are occurring in mortgage lending units and crypto currency related entities. The bond market is also showing us clues of a slowing economy. The 10 Year Treasury note peaked at 3.48% yield on June 14th and ended the month of June with a 3.017% yield. This may suggest the Federal Reserve’s continuous string of interest rate hikes till mid 2023 may end sooner.
The so called “neutral rate” might come in lower than expected suggesting the rate hike cycle may not endure as initially feared. Ultimately the mid-term elections in November often provide a positive inflection point for the equities market. This means the third quarter might still be treacherous period for the stock market.
Our lower beta portfolio served us well in the second quarter’s large market decline. Normally, bad first halves of the year are followed by solid equity returns. We are not convinced it becomes a V shaped recovery that occurs precisely from the midpoint of the calendar year. For that reason, we are prudently trimming certain equity holdings that have had good runs to provide dry powder to nibble at attractively valued cyclical stocks that we view have been overly punished.
We still see opportunities in select mid cap equities that have both attractive free cash flow and valuation characteristics with large upside potential. Over the course of the quarter, we will evaluate our low portfolio beta to determine where we can opportunistically take it higher when the equities markets show signs of bottoming.
This commentary reflects the views of the Brentview Investment Management and is subject to change as market and other conditions warrant. No forecasts are guaranteed. This commentary is provided for informational purposes only and is not an endorsement of any security, sector, or index. The commentary should not be seen as a solicitation or offer to buy or sell any securities. The advisor (Brentview Investment Management, LLC), and their employees and clients, may hold or trade the securities mentioned in this commentary. Diversification does not guarantee a profit or eliminate the risk of a loss. PAST PERFORMANCE IS NOT A GUARANTEE OF FUTURE RESULTS.
If you would like to learn more about Brentview Investment Management and the Dividend Growth Strategy please, click here
 |
 |
 |