
The 1st quarter of 2022 turned into a dramatic pivot point for understanding a company’s underlying business risk. Every day, equity investors around the world gauge and evaluate opportunities based on revenues, cashflows, and earnings. In January, investors were bracing for a less accommodative Federal Reserve. Most if not all, did not expect the late February Ukraine invasion. Seemingly overnight, multinational companies from all corners of the globe had to assess their exposure to the region, the extent of their specific business risk, and the potential steps that each company planned on taking considering the Russian invasion.
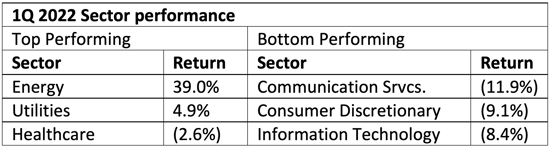
Considering the quickly changing news flow, the Brentview Dividend Growth strategy outperformed the S&P 500, our primary index in the first quarter. On a gross basis the Dividend Growth strategy returned (4.0%) vs. the S&P 500 return of (4.6%). Risk aversion ebbed and flowed with the headlines during the quarter, however, the only index sectors with positive returns were energy and utilities. While the Utility sector was driven by safety, the Energy sector was propelled by Russian’s significance within the overall energy market as seen in table 1. As the coming weeks would unfold, investors would see the knock-on effects from trade sanctions. During the quarter, the weakest sectors normally viewed as growth oriented, were communication services, consumer discretionary, and information technology.
Table 1
Our strategy’s outperformance came primarily in January and February, during the brunt of the market decline. Our mandated requirement to maintain a lower than S&P 500 portfolio beta provided protection despite the fears of rising interest rates and the shock of a sudden war in Ukraine. Ultimately the S&P 500 found some footing in the beginning of March and equities recovered, predominantly attributable to beaten down growth brand leaders like Tesla and Apple. Despite the relief rally, our never-ending responsibility is to assess fundamentals of companies that we either currently own or are interested in potentially buying. Immediately after the invasion occurred, we reviewed our holdings for potential business risk exposure.
To get a better understanding of evolving business risk, we analyzed revenues generated from twelve countries in the impacted region. Information was derived from the most recent annual report figures published by the index constituents. Below are some of some of our key findings. While Russia and Ukraine are clearly areas of focus, peripheral countries such as Belarus, Finland, Georgia, Hungary, Latvia, Moldavia, Poland, Romania, Slovenia, and Sweden were also reviewed.
Since the S&P 500 is comprised of large established multinationals, almost every sector, with exception of Utilities, had some exposure to the collective region.
As a result, and seen in chart 1, Communication Services had the largest average revenue exposure among the eleven GICS sectors. The Consumer Staples sector is the second most impacted sector while Health Care was third most exposed to the region. In addition, when considering five percent of revenue or greater, non-payers, had a higher percentage of total constituents exposed within the region. Additional detail can be found in our special commentary “Ukraine & Russia Update.”
Chart 1
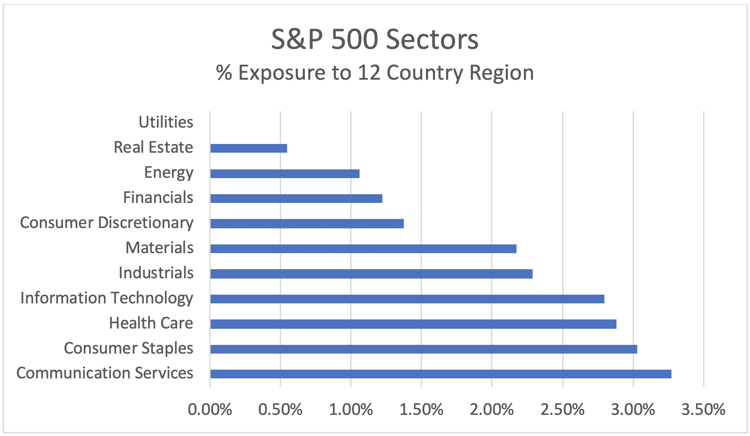
Source: Factset Research
What is the yield curve saying?
A recent topic of discussion has been whether the inverted yield curve is a good predictor of a recession. Many forecasters look at the yields between the 10-year Treasury and 2-year Treasury. As seen in table 2, we have a few inversions as the 2-year Treasury is now on the cusp of yielding more than the 10-year Treasury. However, the 3-year, 5-year, and 7-year Treasuries are all yielding more than the longer term 10 year. Moreover, the 3-year Treasury closed out the quarter yielding more than the 30 year!
Table 2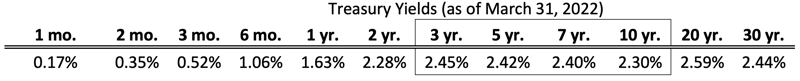
Source: Factset Research
Ultimately, despite all the noise in the yield curve, Brentview considers the yield spread between the 3-month Treasury and 10-year Treasury as a more reliable predictor of a recession. Every recession in the past 60 years has been preceded by an inversion of the 10-year Treasury and the 3-month Treasury.
At quarter end, the 3-month Treasury was yielding 0.52% and the 10-year Treasury yielded 2.38%. As seen in chart 2, the 3-month/10-year spread has been widening (top), even while the spread on the 2-year/10- year narrowed (bottom).
Chart 2
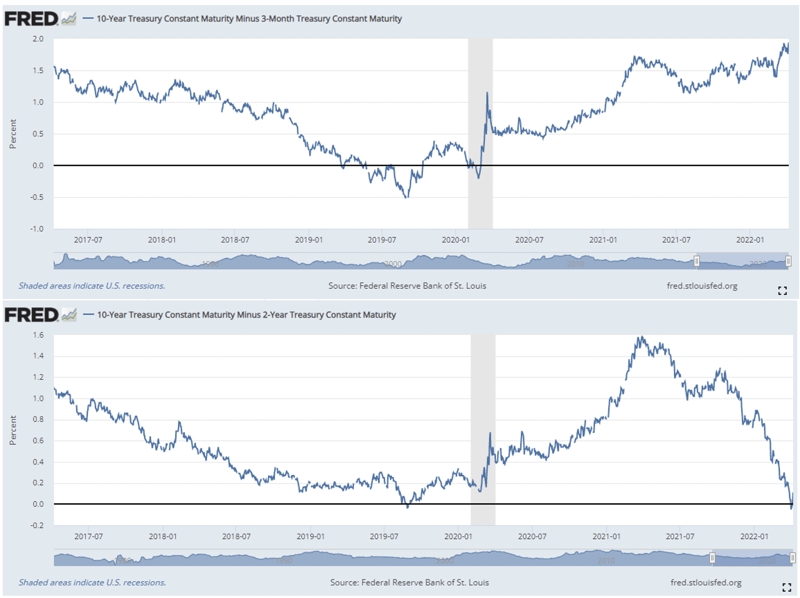
Source: Federal Reserve Bank of St. Louis (FRED Database)
So what is an investor supposed to do with all of these collective signal’s flashing? Our view is that investors run the risk of being too cautious by positioning a portfolio strictly on a bond yield inversion. The reasons are twofold. First, we have often seen a lagging period (1-2 years) before an actual recession occurs. Second, equity markets have historically posted positive returns during these “lag periods” as the economy typically remains stronger than expected.
Another reason to not be bearish is the strength of share buybacks from US corporations. Supported by both cash rich balance sheets and robust corporate profit margin, highest in the past 70 years as seen in chart 3, buybacks are on track to pass last year’s record levels. In fact, in 2021, profits surged 35% for the full year and every quarter saw margins exceed 13% levels. Even the peak of the 1990’s, corporate profit margins were about half of today’s margins.
Chart 3
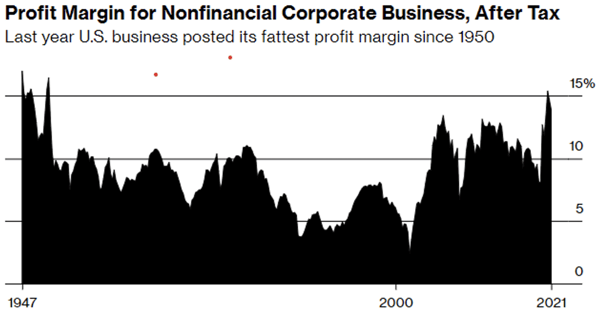
Source: Bureau of Economic Analysis
Margin = seasonally adjusted profit as share of gross value added by nonfinancial corporate business
Finally, as seen in chart 4, Goldman Sachs estimates an all-time high of net corporate equity demand of $700 billion for 2022. While there is currently a proposal in Congress to assess a 1% excise tax on share buybacks, we see little chance that the proposal gets any meaningful traction.
Chart 4
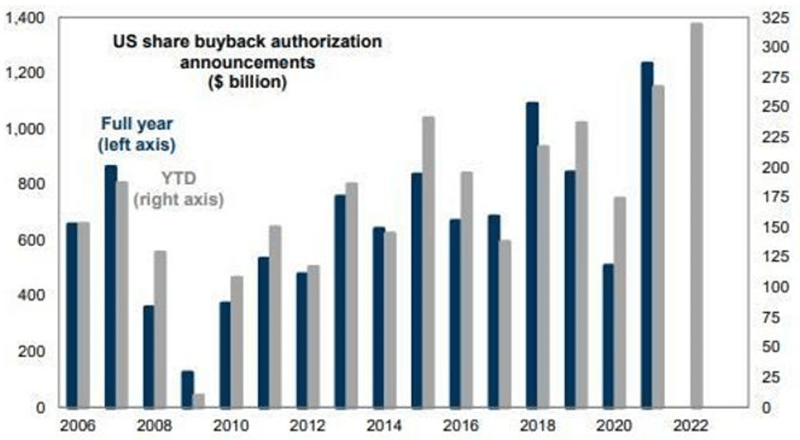
Source: Goldman Sachs Buyback Desk, Goldman Sachs Global Investment Research
Dividend Growth Scorecard
We are very encouraged to see that 29.7% of our portfolio holdings (eleven companies) announced dividend increases of 10.1% on average through March 31st. The companies announcing increases spanned across nine GICS sectors with the Financials sector leading with the largest announced average dividend increase to date.
Even more gratifying is that our mid-2021 sale of AT&T showed that we were ahead of the curve. During the 1st quarter, the broadly held dividend paying company announced an $6.9 billion dollar dividend cut.
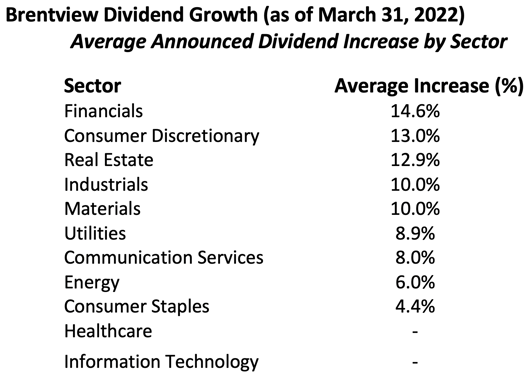
Source: Public company filings
Outlook
What is Brentview doing when considering the current backdrop of strong corporate buybacks and a widening 3 month and 10-year Treasury securities? As a dividend growth manager, we seek companies with strong free cash flows that can support both growing dividend payments and share buybacks.
We are constantly reviewing our portfolio and paying close attention to valuations of our holdings, especially due to the recent market rebound. Historically our strategy has resided in the large cap core style box. As a “core” manager, we strive to maintain a balance between yield and growth in the portfolio. While tempting, higher yielding companies might seem enticing, but they often run the risk of lacking dividend growth as they tend to be more mature businesses.
It’s especially important to note that during the decade of the 40’s and 70’s, dividends were 67% and 73% of total return. Both decades not only shared the significant contributions from dividends but were also decades marked by inflationary pressures. To stay ahead of inflation, we prefer our new holdings provide double digit dividend growth to support a rising income stream over time.
Along these lines, we have identified a few mid-cap stocks that have better growth opportunities than some large and mature dividend paying companies. We also took up the weighting in a stock we expect to be awarded with a special dividend later in the year. A special dividend is not calculated in portfolio yield, thus underestimating the actual income received.
This commentary reflects the views of the Brentview Investment Management and is subject to change as market and other conditions warrant. No forecasts are guaranteed. This commentary is provided for informational purposes only and is not an endorsement of any security, sector, or index. The commentary should not be seen as a solicitation or offer to buy or sell any securities. The advisor (Brentview Investment Management, LLC), and their employees and clients, may hold or trade the securities mentioned in this commentary. Diversification does not guarantee a profit or eliminate the risk of a loss. PAST PERFORMANCE IS NOT A GUARANTEE OF FUTURE RESULTS.
If you would like to learn more about Brentview Investment Management and the Dividend Growth Strategy please, click here
 |
 |
 |