
In the second quarter, our strategy underperformed the S&P 500, our primary index, returning 15.87% vs. 20.54% for the index. Year to date, through June 30th, our strategy underperformed the index by 219 basis points, returning -5.27% vs. -3.08% for the index. Ultimately the second quarter was the best performing quarter for the S&P 500 index since 1998 and the best performing second quarter ever since the S&P 500 index was created in 1957.
During this same timeframe, the Non-Payers of the S&P500 clearly outpaced the index and the Dividend Payers cohort as seen in Exhibit 1. The Non-Payers appreciated by 28.38% during the quarter whereas the Dividend Paying cohort appreciated by 18.03%. It’s especially important to note that the dividend paying cohort was broadly helped by recovering energy, retail, leisure, and apparel segments. While some of the companies within this cohort cut their dividends in recent months, they maintained a minimum dividend to remain a dividend payer.
Exhibit 1. S&P500 vs. Index Non-Payer and Dividend Payer Cohorts
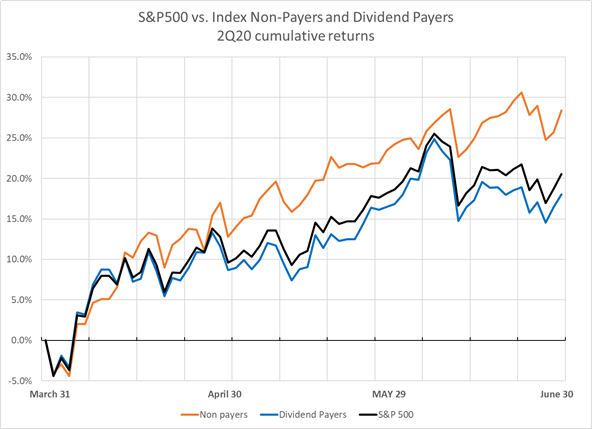
Source: Factset
A historic influx of fiscal and monetary stimulus was deployed to offset the damage the coronavirus pandemic had instilled upon the economy. The Federal Reserve slashed interest rates to zero and committed to purchasing corporate and municipal debt for the first time in its history. In a past commentary we alerted investors to the risk of growing corporate debt, especially issuances rated at the lowest rung of investment grade. Despite the new efforts of the Federal Reserve to support the debt markets, the potential remains for the Fed to ultimately pick winners & losers with its deployed capital.
As of result of the accommodation, the “reflation trade” took hold as the quarter progressed. The best performing sectors were Consumer Discretionary, Energy, and Information Technology, all of which appreciated by over 30%. While recovery in valuations were certainly warranted after the challenging first quarter, the pace of appreciation and strength in certain companies have defied even the rosiest expectations. In short, we see signs of speculation creeping into the market.
For example, the NASDAQ Index gained 30% in the second quarter alone, a pace that seems very difficult to maintain. 2020 has also seen the much-noted rise of Robinhood traders, nicknamed “Hoodies” who have played a part of creating a momentum within select companies. As shown in Exhibit 2, as the quarter progressed, the value of Tesla exploded from $96 billion on March 31st to $154 billion by June 1st, finishing at $204 billion by end of the 2nd quarter. During this incredible rise in capitalization, the number of traders in Tesla, tracked by Robintrack, grew significantly to over 300,000 individuals. While these collective day traders were not solely responsible for the dramatic rise in Tesla’s market value, it’s clearly a sign to note and one that we see with caution.
Exhibit 2. Tesla Market Capitalization vs. Other Automobile Manufactures** with Robintrack popularity overlay
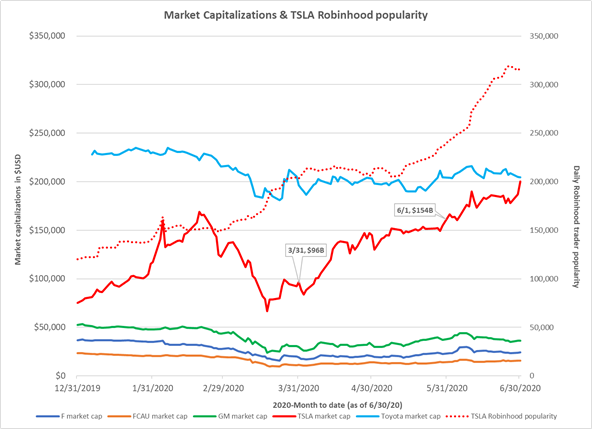
**Averages were used for Toyota ordinary shares within certain timeframes which included market holidays within Japan.
Source: Factset, Robintrack
Despite the number of dismal economic forecasts during this pandemic, signs of an economic recovery are beginning to emerge. Copper prices, often used as a gauge for the underlying economic strength, have rebounded in a similar manner to the stock market. After being down 21% in the first quarter, prices recovered sharply, up 25% in the second quarter. Housing and retail data are also showing positive signs of recovery. After two months of sharp declines during the peak selling season, pending home sales jumped 44% in May, which is the largest gain since data started being tracked in 2001. It seems that the combination of low interest rates and pent-up demand brought buyers back into the housing market. As seen in Exhibit 3, the US Home Construction ETF is up nearly 75% since the March stock market low, compared to a 35% gain for the S&P 500 during that same timeframe.
Exhibit 3. US Home Construction ETF vs S&P 500
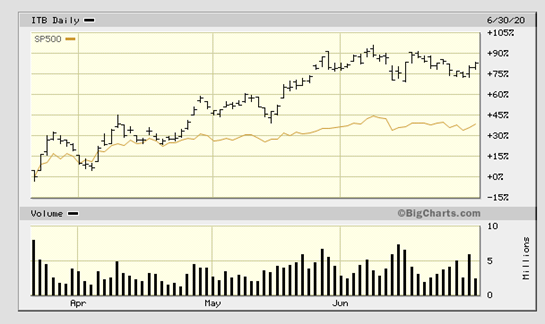
Source: Factset
Retail sales have also rebounded sharply as more stores begin to open after forced lockdowns. According to recent data it seems like the stimulus checks have helped apparel sales drive the rebound. However, bigger ticket items such as automobiles and furniture have also had an impact, as seen in Exhibit 4.
Exhibit 4. Retail Sales by segment
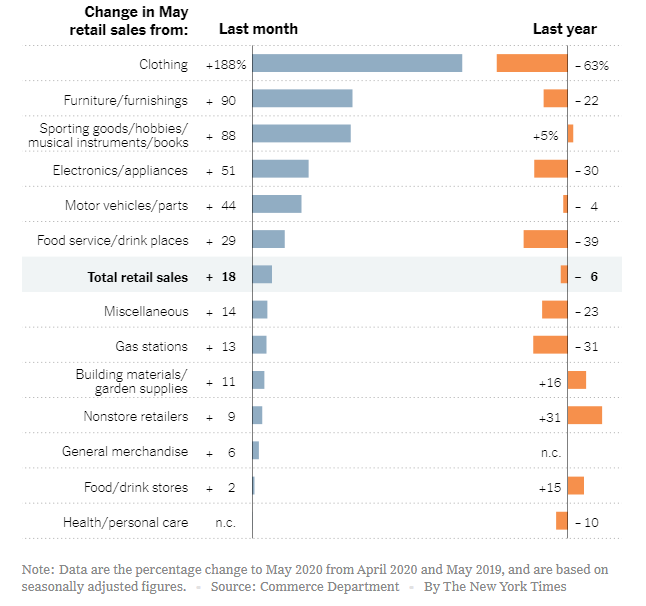
Source: NYT, Commerce Department
The S&P 500 is currently trading at 19x 2021 forecasted EPS of $162 and nearly 17x 2022 forecasted EPS of $186, causing valuation concerns. The question many investors grapple with right now is determining the timing of when normalized profits may occur; some expecting that not to occur until 2022. Despite these historically lofty valuations, the backdrop of low interest rates, and an interest rate environment that will remain “lower for longer”, makes stocks more attractive.
In the coming months investors will turn their eyes towards the Presidential election, which could potentially impact sectors and industries as this event comes into focus. As an investor, the changing landscape and backdrop means a constant assessment of business risk, which requires diversifying our strategy accordingly. Based on our past observations it appears that if the Democrats were to win the White House and flip the Senate, the odds of tax increases will become more certain. Presidential Candidate Biden has said that he will aim to raise corporate taxes to 28% from their current 21% level. Additionally, income taxes for higher wage earners and taxes on capital gains could also trend higher. Senator Elizabeth Warren has also been rumored to be named Treasury Secretary, which could mean stronger banking regulations. As a result, the financial sector might be a worthwhile sector to watch.
In light of all these factors, Brentview’s outlook continues to follow the mantra of “Don’t Fight the Fed.” The unprecedented amount of fiscal and monetary stimulus being pumped through the system has added ample liquidity in the credit markets and should continue to support stock prices. Markets have been resilient since the March lows with only a handful of concurrent down days.
Our recent portfolio moves have been tied to discretionary spending by consumers. We believe that we can capitalize on this trend in companies that fall outside of the traditional consumer discretionary stocks. As has been the case from the start, balance sheet strength is still important in this environment. A strong balance sheet allows for the continued support of dividends, share buybacks, or consolidating market share from weakened competitors. The Brentview Dividend Growth Portfolio targets lower volatility than the market, as measured by beta. This approach has been a key tenant of our philosophy since its original inception. As markets evolve, so does the volatility of each stock. As a result, certain defensive industry sectors saw their volatility rise over the last 12 months. As a result of these changes we made some modifications with our portfolio weighting to ensure that our portfolio volatility is muted and falls in line with our core philosophy.
This commentary reflects the views of the Brentview Investment Management and is subject to change as market and other conditions warrant. No forecasts are guaranteed. This commentary is provided for informational purposes only and is not an endorsement of any security, sector, or index. The commentary should not be seen as a solicitation or offer to buy or sell any securities. The advisor (Brentview Investment Management, LLC), and their employees and clients, may hold or trade the securities mentioned in this commentary. Diversification does not guarantee a profit or eliminate the risk of a loss. PAST PERFORMANCE IS NOT A GUARANTEE OF FUTURE RESULTS.
If you would like to learn more about Brentview Investment Management and the Dividend Growth Strategy please, click here
 |
 |
 |